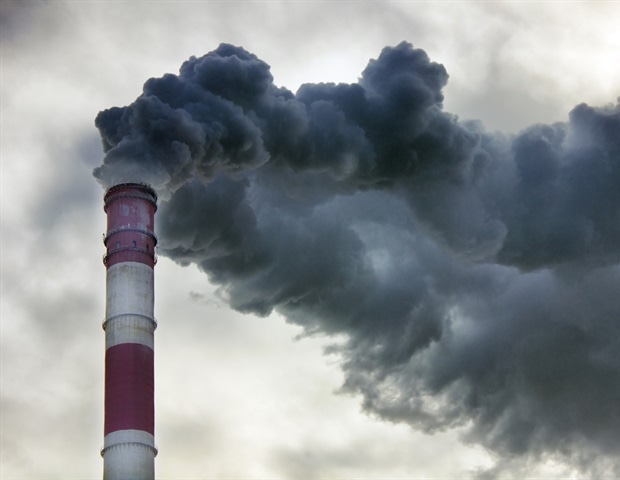
New research builds on scientific understanding of how air pollution and cancer risk are distributed throughout the U.S. Air pollution, often resulting from industrial or vehicle emissions, can travel for hundreds of miles and impact the health of communities through higher rates of asthma, respiratory infections, stroke, and lung cancer. Although previous studies have identified disparities in how public health risks vary by income and race, a new study takes a detailed look across U.S. census tracts to find patterns in who is most at risk from cancer resulting from lifetime exposure to air pollution and how this risk is changing through time.
Researchers from Desert Research Institute (DRI) and the University of Nevada, Reno (UNR) teamed up for the new study, published October in Environmental Science & Technology. Using sociodemographic data from the U.S. Census Bureau and public health and air pollution information from the U.S. Environmental Protection Agency (EPA) between 2011 and 2019, the study identified higher estimated cancer risk tied to air toxics in urban communities, those with lower incomes, and those with higher proportions of racial minorities.
“I wanted to look holistically at poor health outcomes from air pollution exposure throughout the country and through time to see if things are getting better or worse, and what the main socioeconomic drivers are for where the pollution is being distributed,” says Patrick Hurbain, postdoctoral researcher and environmental epidemiologist at DRI who led the study.
Although previous studies have identified public health disparities related to specific air pollutants, this is one of the first to look at air pollution loads as a whole and changes over time. Public and environmental health data came from the EPA’s Air Toxics Screening Assessment. This publicly available tool maps concentrations of hundreds of toxic air pollutants from all sources, as well as cancer risk estimates tied to lifetime exposure across U.S. census tracts.
Census tracts with the highest estimated cancer risk were found in urban communities, with racial demographics showing stronger correlations with disparities than either income or education level. Communities with the highest levels of estimated cancer risk, like “Cancer Alley” in southern Louisiana, have significantly more Black and Hispanic community members compared to White individuals. This racial disparity was not consistent in rural and suburban communities, where larger White populations showed higher burdens of cancer risk.
There is a definite effect of the social makeup of an area with respect to their estimated risk from air pollution.”
Patrick Hurbain, Desert Research Institute
The study found that racial disparities peaked in 2011, with the magnitude of the disparity improving in later years. “That means that air pollution control measures are doing better, and people are, in fact, getting less air toxics across the country, which is exciting,” Hurbain says.
Disparities for lower income communities, however, were found to be consistent through time.
Hurbain hopes to expand on the research by focusing on the most impacted communities and taking a closer look at factors like the age of housing, poverty levels, and surrounding industries to identify ways to improve public health.
With publicly available data like the map used for this study, Hurbain hopes that more people will get involved in examining the risks in their own communities. “Everyone can be a citizen scientist and start looking at the state of our environment,” he says.
Source:
Journal reference:
Hurbain, P., et al. (2024) Environmental Inequality in Estimated Cancer Risk from Airborne Toxic Exposure across United States Communities from 2011 to 2019. Environmental Science & Technology. doi.org/10.1021/acs.est.4c02526.


